MAY 29, 2026
The INR depreciation case: 22 years of data every Indian investor should see
Data deep-dive · Currency risk · 2004–2026
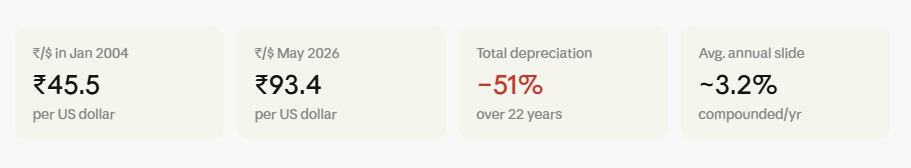
The rupee has lost over 50% of its value against the dollar since 2004 — crossing ₹93 in May 2026. Every rupee-only portfolio quietly bears this burden. Here's what the data actually shows.
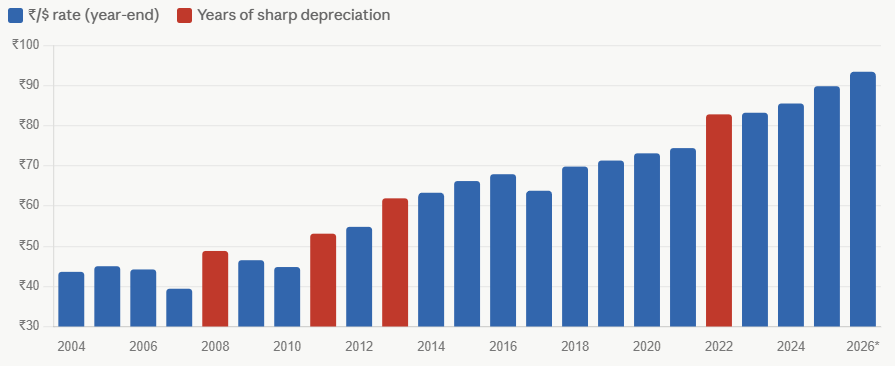
₹/$ year-end exchange rate, 2004–2026
Annual year-end spot rates. Note the rupee was ~₹39 in early 2008 (strongest point) before falling sharply. The rate has more than doubled from 2004 lows to 2026.
Key observation
The rupee hit its strongest point (~₹39/$) in early 2008 amid strong capital inflows, then collapsed 25% in months during the GFC. The 2013 "taper tantrum" and 2022 dollar surge caused further step-downs. By 2026 the rate is ~₹93 — more than double the 2004 level.
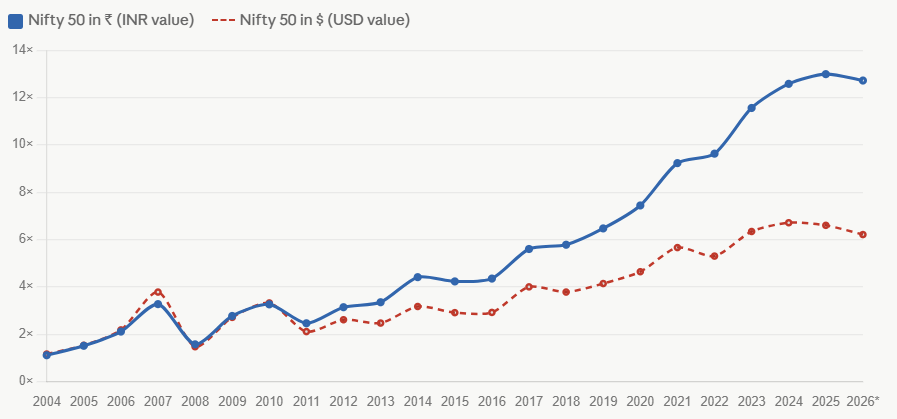
Nifty 50: returns in ₹ vs returns in $ (same investment, two currencies)
₹1 Cr invested in Nifty 50 at end of 2003. Left axis = INR value. The dollar-adjusted line shows what a foreign investor (or an Indian measuring in USD) actually earned — always lower due to currency drag.
Key observation
Nifty 50 grew ~12.6× in INR terms (2003–2026). But in USD terms, that same investment grew only ~6.2× — because every rupee earned buys fewer dollars than before. The 6× gap is entirely the currency drag. This is the hidden cost of an INR-only portfolio.
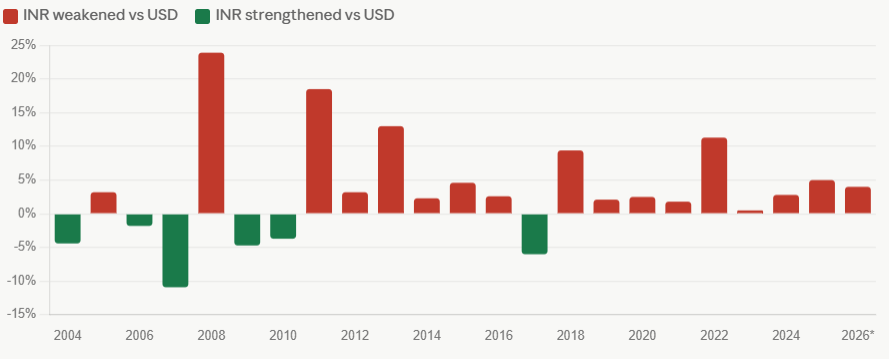
Annual INR depreciation vs USD, 2004–2026
Positive bars = rupee fell vs dollar that year. Negative = rupee gained. The asymmetry is structural.
Key observation
In 17 of 22 years, the rupee weakened. Only 2007, 2010, 2017 saw meaningful appreciation — all driven by global risk-on and dollar weakness, not India-specific strength. The 2022 spike (+11% depreciation) and continued slide through 2026 underscore the structural trend.